
How To Read And Understand Image Histograms In Photoshop
One of the most valuable tools we have when editing and correcting images in Photoshop is the histogram. In fact, histograms are so valuable, they're not limited to just Photoshop. You'll find histograms in lots of other image editing programs as well, like Adobe Lightroom, Photoshop Elements, and Photoshop's own Camera Raw plugin. Many digital cameras today also include a handy histogram feature. In the world of photography and photo editing, histograms are everywhere!
So, what exactly is a histogram? Quite simply, a histogram is a graph. Now, I know, as soon as I mention the word "graph", some people will want to take a nap, but I promise you, this is easy stuff. It's also very important stuff if you're serious about your images (and if you're reading this, it's a safe bet that you are). A histogram is a graph that shows us the current tonal range of an image so we can evaluate it and, if necessary, correct it. By tonal range, I mean the range of brightness levels in the image. A histogram shows us how much of the image is currently pure black, how much is currently pure white, and how much of it falls somewhere in between.
It's important to note here that even though we're talking about brightness levels, we're not just talking about black and white (grayscale) images. Histograms work equally well, and are equally important, with full color photos. That's because, even though we don't always think of color as being anything more than, well, color, every color in your image has its own brightness level. Yellows, for example, are typically very light; blues are much darker. These differences in brightness values mean that color can have a huge impact on the tonal range of your image.
How does being able to see the tonal range of an image help us? Well, have you ever looked at a photo and thought it seemed a little "flat"? The subject was interesting, the composition was good, but overall, it just wasn't "popping out" at you? Chances are, it's because the image was suffering from low contrast; the highlights (the lightest areas of the image) were most likely too dark and the shadows (the darkest areas) were not as dark as they should have been.
Now, you may have been able to recognize that just by looking at the photo with your own eyes, but when it comes to image editing, the sad truth is, our eyes are not as reliable as you may think. They're great at comparing two images side by side and recognizing which one is better, but when it comes to evaluating a single image, they can be easily fooled into seeing certain areas as either lighter or darker than they really are. Your computer's display (monitor) can also add to the problem if it hasn't been properly calibrated. Setting your screen's brightness too high, for example, can make your images look fantastic on screen but dark and disappointing when you go to print them. A histogram overcomes both of these problems. It doesn't rely on your eyesight or your display settings. Instead, it gets its information directly from the image itself so it's always showing you an accurate, reliable view of the tonal range, making issues such as poor contrast easy to spot and, as we'll see in our Levels and Curves tutorials, easy to fix!
Another common problem we run into with image editing is shadow and highlight clipping, where the shadows are so dark, they're become nothing more than areas of pure black, and the highlights are so light, they're just areas of solid white. You may have heard it referred to as "plugging up" or "crushing" the shadows, or "blowing out" the highlights, but it all means the same thing; we've lost image detail.
Just as with the issue of poor contrast, it's not always easy for us to recognize these clipping problems just by looking at the photo on the screen. Our eyes are simply not sensitive enough, and our computer's display may not be showing us a truly accurate representation of the image. The histogram, however, will always show us if we've gone too far with our editing and need to back things off to bring back detail. Or, if we're restoring an old photograph, the histogram can tell us if the original image itself is missing detail in the highlights or shadows so we know where we're starting from and what we're dealing with. Bottom line, if you're retouching or restoring images and don't know how to read and understand what the histogram is telling you, then you and your photos are at a serious disadvantage.
Viewing The Histogram In Photoshop
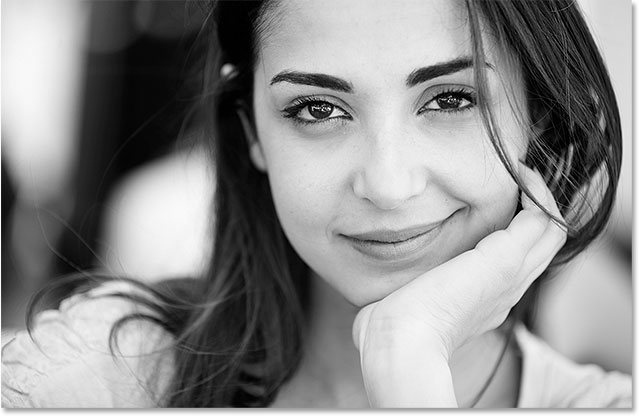
There's a few places in Photoshop where we can view the histogram for the image we're working on, including an actual Histogram panel. But to help us understand exactly how a histogram works and what it's showing us, the best place to view it is inside Photoshop's Levels dialog box. To access Levels and view the histogram, you'll need to have an image open. I mentioned earlier that histograms work equally well with both full color and black and white photos, but to keep things simple, let's start with a black and white image (black and white portrait from Adobe Stock):
To select Levels, I'll go up to the Image menu in the Menu Bar along the top of the screen where I'll choose Adjustments, then Levels:

This opens the Levels dialog box. We'll save our discussion about how to use Levels to correct images for another tutorial. Here, we're simply using it to help us understand how histograms work:

The histogram is that black area in the middle that looks like a mountain range. Depending on the image you're viewing on your screen, your histogram may look similar to mine or it may look completely different, and that's okay. Every image will have its own unique histogram, and you'll understand why that is in a few moments:

How does viewing the histogram inside the Levels dialog box make it easier for us to understand? It's because, if you look below the histogram in Levels, you'll see a horizontal gradient bar. The gradient starts with pure black on the far left and gradually gets brighter until reaching pure white on the far right:

As we've learned, histograms show us the current range of brightness levels in our image, and the brightness levels in the histogram match up exactly with the gradient bar below it! Histograms start with pure black on the far left, just like the gradient. They end with pure white on the far right, just like the gradient, and they gradually increase in brightness values from left to right, just like... you guessed it, the gradient:

So why does the histogram look like a mountain range? That's because it's showing us the current distribution of brightness levels, or tonal values, in the image. In other words, it shows us how much of the image is at a certain brightness level in comparison to the other brightness levels. That's why some parts of the histogram appear taller than others. The taller the histogram appears at a certain brightness level, the higher the number of pixels we have in our image at that same level. In areas where the histogram is shorter, we have fewer pixels in the image at those brightness levels. And if the histogram doesn't appear at all over certain areas of the gradient, it means we currently have no pixels in our image at those brightness levels.
It's important to keep in mind that the histogram is not showing us the actual number of pixels in the image. That's because most digital cameras these days are capable of taking photos that are 10 to 20 megapixels (millions of pixels) or more in size. To fit them all into the histogram, you would need multiple screens to view it! So instead, the histogram simply gives us an overall, birds eye view of how the tonal range of the image is being distributed across the highlights, midtones and shadows, and if any areas are being clipped to pure black or white.
Generally speaking, a well-exposed image will display a histogram showing a full, continuous range of brightness levels from black to white, and we see an example of that with this image. The left side of my histogram begins right up against that left "wall" of the histogram box, directly over pure black in the gradient below it. This means that some of the pixels in the image are already black (the darkest they can possibly be). I'll zoom in closer so we can get a better view:

Over on the other side of the histogram, we see that it extends pretty much as far to the right as it can go, with a tiny sliver of it appearing directly over pure white in the gradient below it. This tells us that some of the pixels in the image are already white (the lightest they can be). So, already we know that our black and white points are looking good:

What does the rest of the histogram tell us? Well, typically, we read a histogram from left to right (darkest to lightest). If we start on the left and begin moving towards the right, we see that the histogram immediately begins to rise over the dark shadow tones, but then drops off as we get closer to the midtones in the center. It then rises again and reaches its peak over the lighter highlight tones before rapidly dropping off as we get close to white:

Since the highest part of the histogram is over the lighter tones (the highlights), this tells us that most of the pixels in the image fall within that lighter tone range. We have a lesser but still considerable amount of very dark tones in the image, indicated by the rise in the histogram over the shadows. And finally, the slope over the midtones in the center tells us that while we do have detail in that midtone range, there isn't as much of it as there is in both the highlights and shadows.
Let's look at the photo again, where we see that sure enough, most of it is made up of those lighter tones (the woman's skin, the whites of her eyes, her sweater, and much of the background). We also have a considerable amount of very dark tones (her hair, eyebrows, eyes, and a smaller section of the background). There really isn't much in the way of midtones, at least not when compared with the amount of highlight and shadow detail, and this is typical of a high contrast black and white image. So, the histogram did a great job of showing us the tonal range of this photo:
Let's look at a second image, this time a full color photo (bride and groom photo from Fotolia):

I'll once again open the Levels dialog box so we can view the image histogram. But this time, rather than going up to the Image menu, choosing Adjustments and then choosing Levels, I'll open the Levels dialog box by simply pressing Ctrl+L (Win) / Command+L (Mac) on my keyboard. Either way works; the keyboard shortcut is just faster:

Let's zoom in closer and see what this histogram is telling us. Here again, we're seeing an example of an image that's well-exposed. The left side of the histogram starts at pure black and the right side ends at pure white, so we know that our tonal range extends to both extremes:

Reading the histogram from left to right (darkest to lightest), we see that it rises quickly over the shadow tones. But, unlike the previous image where the histogram dropped off in the midtones, this one stays relatively constant all the way up into the highlights where it takes a sudden, sharp turn upwards before dropping off at pure white:

What does this tell us? It tells us that we have plenty of image detail in all three areas (shadows, midtones and highlights), but that we have more detail in the lighter tones than anywhere else. Again, we can see this when looking at the image. The man's shirt and the woman's dress, both of which are white (or close to it) make up a large part of the photo, so that explains why the histogram is at its tallest over the highlights:
Using The Histogram To Spot Problems
So far, we've looked at histograms for images that were properly exposed, but a histogram can just as easily reveal problems. For example, what if the histogram was showing a tall spike right up against that right wall of the histogram box:

This is usually a sign that the image is overexposed. The tall spike pushed up against that right edge means we have lots of pixels in the image that are pure white, and that means we're most likely missing detail in the highlights. To show the effect is has on the image, here's a comparison of the man's shirt. The image on the left is properly exposed, revealing lots of detail. The image on the right is overexposed with highlights clipped to pure white. Notice how much detail in the shirt is lost:

Likewise, what if the histogram showed a similar tall spike, this time up against the left wall:

This usually means the image is underexposed with lots of pixels clipped to pure black, which means we've lost detail in the shadows. Again to show the effect this has on the image, here's another comparison. In the well-exposed version on the left, we see lots of detail in the man's hair. In the version on the right which suffers from shadow clipping, much of the detail in his hair has been lost to pure black:

If you noticed these clipping problems when viewing the histogram on your camera's LCD screen right after taking the photos, you'd most likely adjust your exposure settings and re-shoot them. In Photoshop, you may be able to correct these issues using Levels, Curves or Camera Raw, and we'll learn how to do that in other tutorials. For now, all we're concerned with is learning about the histogram itself.
How Many Brightness Levels Are There In A Histogram?
At this point, we know that the histogram displays the range of tones in the image from pure black to pure white. But how many tones are there, exactly, in a histogram? Is there a specific number of brightness levels that the histogram displays? Why yes, there is! A histogram displays exactly 256 brightness levels, with one vertical black bar for each of those 256 levels, although depending on the tonal range of your image, you may not actually see a black bar at every level. If you get in close, though, and look along the top of a histogram, you'll notice that it's not smooth. Rather, it's made up of tiny little spikes and ridges, each one being the top of a thin vertical bar. If you count them, assuming you have a continuous histogram from black to white (and nothing better to do), you'll find exactly 256 bars:

Why 256? There's a couple of reasons for it. First, most of us need roughly 200 brightness levels from black to white in order for our eyes to see what looks like a continuous tone image; that is, an image that flows seamlessly from one tone to the next without any visible gaps or breaks between them. If we drop much below that, we start seeing banding and posterization, where jumps from one tone to the next become obvious. So that explains why the number is at least 200. But why 256? Why not 257, or 300, or 500?
That's because of how computers work. We need our images to contain at least 200 brightness levels, but computers need to be able to process and store the images as bits and bytes. Long story short, the best way to meet both of these needs is to store images as 8-bit files (a standard JPEG image is an example of an 8-bit file). An 8-bit image file contains exactly 256 possible brightness levels, which gives us the 200 or so we need for continuous tone, plus a little extra left over for editing purposes. Still wondering where the the number 256 comes from? If you think of 1 bit as being equal to 2, then 8 bits is 28, or 2x2x2x2x2x2x2x2, which equals 256.
If you didn't quite follow that, don't worry. You can get all the benefits of histograms without knowing a thing about bits and bytes. All we really need to know is that a histogram displays a range of 256 possible brightness levels from black to white. In fact, we can actually see this if we look at the numbers below the left and right sides of the histogram in the Levels dialog box. On the left side, we see the number 0 which represents pure black. On the right, we see the number 255 which represents pure white. Why do the numbers go from 0 to 255, not 1 to 256? Again, it's because of how computers work. Normally, we start counting from the number 1, but computers start counting from 0:

And there we have it! In this tutorial, we learned how to read an image histogram and how to recognize the difference between a well-exposed photo and one that suffers from shadow or highlight clipping. We used Photoshop's Levels dialog box to help us visualize the tonal range that a histogram represents, with black on the left, white on the right and a gradual transition from shadows to midtones to highlights in between. Something to keep in mind is that depending on where you're viewing a histogram, you won't always see a handy black to white gradient below it. That's okay though, because now that you understand how histograms work (and they all work the same way), you don't really need it.
So far, we’ve looked at examples of what a histogram typically looks like when an image is properly exposed, with a full range of tonal values from black to white. But that’s not always the case. Sometimes, it makes more sense to limit the tonal range of an image, forcing most of it into the shadows or highlights in order to create a specific mood or style.
In the next tutorial, Understanding Histograms - Low-Key And High-Key Images, we'll look at examples of these types of photos (known as low-key and high-key images) and get a better sense of why there's really no such thing as an "ideal" or "perfect" histogram.